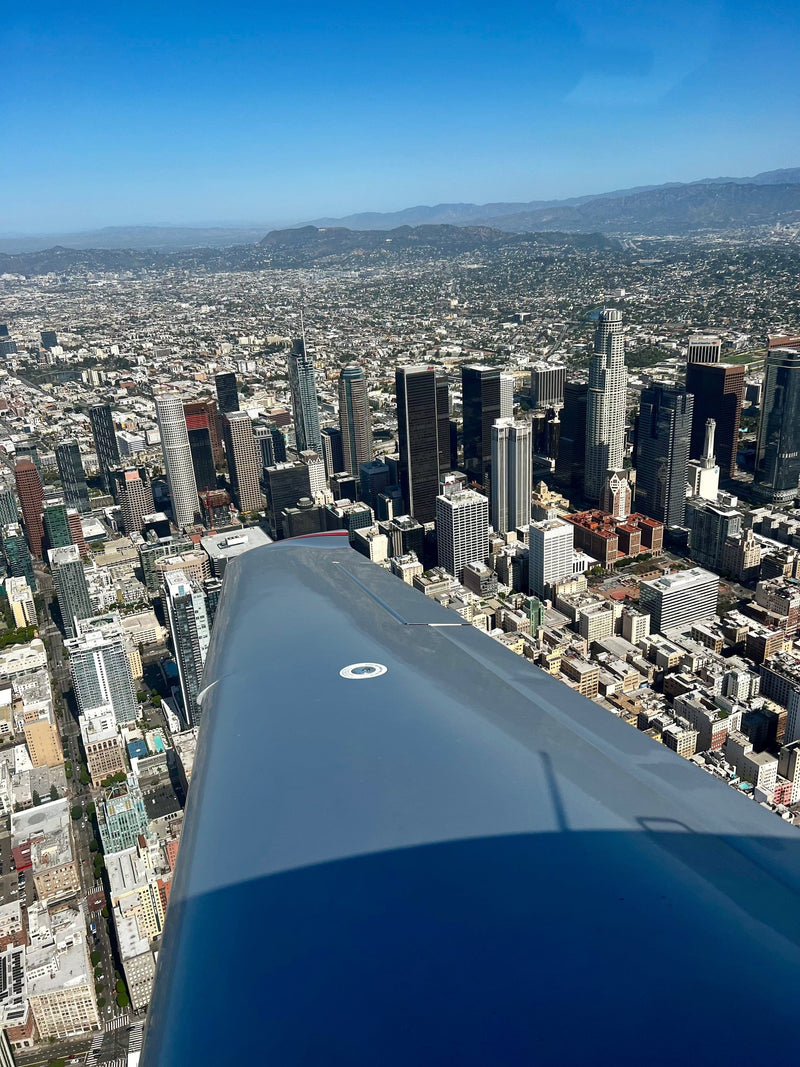
We counted every flyable hour at 15 US training airports
Twelve months of NOAA weather observations, one honest question: on how many days can a student pilot actually fly? Van Nuys came out at 355 days a year — level with Phoenix, level with central Florida, and 78 days ahead of Oregon.
Everyone says “300 days of sunshine”. Nobody checks.
Every flight school in a warm state claims roughly 300 flyable days a year. We have said it ourselves on this website. It is the kind of number that gets repeated until it stops being a claim and starts being furniture, and as far as we can tell nobody has ever actually measured it for flight training.
So we did. We pulled twelve months of routine hourly weather observations from fifteen airports that people genuinely train at, applied a threshold a flight school would actually use for a student, and counted.
Two things surprised us. The first is that our own number was too low — Van Nuys came out at 355 days, not 300. The second is that the headline number is the wrong thing to look at, and the hour-by-hour data underneath it is far more useful to anyone booking a lesson. That part is further down, and it is the reason this page exists.

What we measured, and what counts as flyable
The full method is written out at the bottom of this page so anyone can check it or repeat it. The short version:
The data
Routine hourly METAR observations from the Automated Surface Observing System at each airport, 1 August 2025 to 1 August 2026, retrieved from the Iowa Environmental Mesonet archive of NOAA observations.
The threshold
Ceiling at or above 3,000 feet and visibility at or above 5 statute miles. That is not the legal minimum — it is the more conservative standard most schools apply to student solo and early dual instruction.
A flyable day
At least four daytime hours meeting that threshold, between 07:00 and 18:00 local time. Four hours is roughly two lesson slots once you count preflight and debrief.
Ceiling means the lowest broken or overcast layer. Scattered cloud is not a ceiling and is excluded, which is how the FAA defines it. Local time is applied per airport, so daylight saving and time zones are handled correctly.
Flyable days per year, fifteen airports
Sorted by days meeting training minima. Van Nuys is highlighted. The basic VFR column uses the legal floor of 1,000 feet and 3 miles, which is why every airport scores higher on it — and why it is a misleading number to quote at a student.
| Airport | Region | Days observed | Basic VFR | Training minima |
|---|---|---|---|---|
| BUR Hollywood Burbank | Los Angeles basin (inland valley) | 364 | 363 | 356 |
| DVT Phoenix Deer Valley | Arizona | 361 | 356 | 356 |
| VNY Van Nuys | Los Angeles basin (inland valley) | 364 | 363 | 355 |
| ISM Kissimmee | Florida | 362 | 361 | 355 |
| APA Centennial Denver | Colorado | 365 | 360 | 353 |
| LGB Long Beach | Los Angeles basin (coastal) | 359 | 354 | 346 |
| CMA Camarillo | Ventura County (coastal) | 364 | 362 | 346 |
| SMO Santa Monica | Los Angeles basin (coastal) | 363 | 358 | 343 |
| EMT El Monte | San Gabriel Valley | 362 | 354 | 342 |
| WHP Whiteman | Los Angeles basin (inland valley) | 365 | 357 | 334 |
| TOA Zamperini Field Torrance | Los Angeles basin (coastal) | 365 | 362 | 332 |
| FRG Republic Farmingdale | New York | 365 | 348 | 323 |
| DPA DuPage Chicago | Illinois | 365 | 359 | 321 |
| PAE Paine Field Everett | Washington | 365 | 332 | 278 |
| HIO Hillsboro | Oregon | 351 | 312 | 277 |
Days observed falls short of 365 at some fields because of station outages. Percentages in the discussion below are calculated against days actually observed, not against 365.
Three findings worth arguing about
Los Angeles is as flyable as Arizona
Van Nuys at 355 and Burbank at 356 sit level with Phoenix Deer Valley at 356 and Kissimmee, Florida at 355. The common advice to move to the desert to train faster is not supported by the weather data. It may be supported by cost or airspace, but not by this.
Inland beats coastal, inside the same city
Van Nuys 355, Whiteman 334, Santa Monica 343, Torrance 332. These fields are within thirty miles of each other. The difference is the marine layer, and it lands hardest on the coastal ones.
The Pacific Northwest gap is enormous
Hillsboro 277 and Everett 278 against Van Nuys 355. That is 78 fewer usable days a year. At two lessons a week, a student in Oregon loses the equivalent of two and a half months of training calendar to weather alone.
The day count hides the thing that actually cancels your lesson
Van Nuys scoring 355 out of 364 makes it sound like weather is a non-issue. It is not. The marine layer does not take whole days away in Los Angeles — it takes mornings. A day where the ceiling lifts at 11am still counts as flyable, and it still cancelled somebody’s 8am lesson.
So we recalculated by hour. Each cell below is the percentage of observations at that hour, in that month, that met training minima across the full twelve months.
| Van Nuys (VNY) | 7:00 | 8:00 | 9:00 | 10:00 | 11:00 | 12:00 | 13:00 | 14:00 | 15:00 | 16:00 |
|---|---|---|---|---|---|---|---|---|---|---|
| Jan | 87 | 84 | 90 | 90 | 90 | 90 | 90 | 90 | 94 | 94 |
| Feb | 86 | 89 | 82 | 86 | 89 | 96 | 96 | 96 | 93 | 96 |
| Mar | 75 | 77 | 84 | 94 | 94 | 97 | 100 | 100 | 100 | 100 |
| Apr | 77 | 83 | 90 | 100 | 97 | 97 | 93 | 97 | 100 | 100 |
| May | 45 | 52 | 58 | 74 | 84 | 90 | 90 | 97 | 100 | 100 |
| Jun | 40 | 47 | 70 | 83 | 93 | 93 | 97 | 97 | 100 | 100 |
| Jul | 84 | 87 | 94 | 97 | 93 | 100 | 100 | 100 | 100 | 100 |
| Aug | 84 | 81 | 87 | 94 | 100 | 100 | 100 | 100 | 100 | 100 |
| Sep | 69 | 62 | 79 | 90 | 90 | 93 | 93 | 93 | 100 | 100 |
| Oct | 65 | 65 | 74 | 77 | 90 | 97 | 97 | 97 | 100 | 100 |
| Nov | 73 | 77 | 80 | 93 | 87 | 93 | 93 | 90 | 90 | 87 |
| Dec | 77 | 81 | 81 | 87 | 87 | 90 | 90 | 97 | 100 | 97 |
Green is 85% or better. Amber is marginal. Red is below 55% — a coin flip at best.
In May and June, a 7am lesson at Van Nuys is a coin toss
40% of 7am observations in June met training minima. 47% at 8am. By 11am it is 93%, and from 1pm onward it is 97 to 100%. May follows the same shape: 45% at 7am, 100% by 3pm.
This is the single most useful thing in the dataset, and it is not complicated. If you are training at Van Nuys between roughly May and September and you have any flexibility at all, book afternoons. If you can only fly early mornings, expect to lose some of them between May and July and plan around it — a simulator session instead of a cancellation, which is exactly what the Redbird is for.
Note that the pattern almost inverts in November and December. Late afternoons drop off as the sun goes down early and low cloud moves in, and the mid-morning slots become the reliable ones. Nobody tells students this. It is in the data.
The same table for a coastal field
Santa Monica, eleven miles from the ocean, for contrast with Van Nuys sitting inland behind the hills. Same twelve months, same threshold, same method.
| Santa Monica (SMO) | 7:00 | 8:00 | 9:00 | 10:00 | 11:00 | 12:00 | 13:00 | 14:00 | 15:00 | 16:00 |
|---|---|---|---|---|---|---|---|---|---|---|
| Jan | 83 | 83 | 84 | 90 | 81 | 90 | 94 | 90 | 90 | 90 |
| Feb | 96 | 93 | 89 | 89 | 93 | 93 | 100 | 96 | 96 | 100 |
| Mar | 60 | 55 | 70 | 87 | 83 | 79 | 90 | 90 | 93 | 97 |
| Apr | 77 | 83 | 97 | 97 | 93 | 93 | 97 | 97 | 97 | 97 |
| May | 52 | 58 | 52 | 61 | 71 | 90 | 94 | 97 | 94 | 94 |
| Jun | 33 | 30 | 45 | 50 | 77 | 90 | 93 | 93 | 97 | 93 |
| Jul | 71 | 74 | 90 | 97 | 94 | 97 | 97 | 97 | 100 | 97 |
| Aug | 48 | 55 | 77 | 84 | 87 | 94 | 97 | 90 | 94 | 90 |
| Sep | 55 | 66 | 72 | 79 | 86 | 90 | 90 | 93 | 90 | 93 |
| Oct | 61 | 71 | 74 | 77 | 83 | 87 | 90 | 97 | 97 | 97 |
| Nov | 53 | 59 | 63 | 80 | 73 | 87 | 90 | 83 | 77 | 77 |
| Dec | 65 | 65 | 68 | 74 | 71 | 71 | 77 | 77 | 87 | 81 |
June at 7am: 33% at Santa Monica against 40% at Van Nuys. August at 7am: 48% against 84%. December afternoons: 77–81% against 90–100%. The marine layer is a coastal tax, and it is bigger than most people assume.
What this study does not tell you
Ceiling and visibility are two variables out of many. Wind, turbulence, crosswind component and density altitude all scrub lessons on days this study counts as perfect. A gusty, clear afternoon in the Santa Ana season is a green cell in these tables and a cancelled student solo in real life.
ASOS is automated. It occasionally misreads thin layers, and it does not see everything a pilot sees.
This is one year. Marine layer behaviour shifts with sea surface temperature, so treat a single month as indicative rather than settled. We intend to rerun this every August and publish the update, at which point the multi-year picture becomes worth more than this one.
And the threshold is a judgement call. We chose 3,000 and 5 because it is what a careful school uses for a student. A confident instrument-rated pilot would call a 1,500-foot ceiling a fine day. Both numbers are in the table above so you can pick your own.

Reuse this data freely
The numbers on this page are computed from public NOAA observations and we are not going to pretend to own them. Journalists, instructors, other schools and students are welcome to reproduce the tables. A link back to this page is appreciated but not required. If you want the underlying CSVs or the exact query URLs, email us and we will send them.
Cite it as
LA Flight School, “Flyable Days at 15 US Training Airports”, August 2026. Computed from NOAA ASOS observations, 1 Aug 2025 – 1 Aug 2026.
Source data
Automated Surface Observing System routine hourly reports, retrieved from the Iowa Environmental Mesonet archive. Roughly 120,000 observations across fifteen stations.
Next update
August 2027, adding a second full year. We will keep the method identical so the two years are comparable.
What we do with the mornings the weather takes
Forty percent of June 7am slots being unusable is a real cost to a student on a schedule. The answer is not to pretend it does not happen. It is a full-motion simulator that is never cancelled for a ceiling, where procedures, instrument scan and radio work all transfer straight to the aircraft.
Simulator hours are built into every private pilot program — 2 hours on Standard and Premium, 5 hours on Comprehensive. A standalone session is $189.
The aircraft these numbers apply to
Every aircraft on our ramp at Van Nuys is one we own and maintain. The weather above is the weather they fly in.


4.9 stars, 500+ reviews
Across Google and Yelp, and scheduling is one of the three things reviewers mention most.
Instructors who actually teach
The most repeated compliment in our reviews is the debrief after the flight, not the aircraft.
Scheduling that holds
Eleven instructors and a fleet we own. When weather does take a morning, we rebook it rather than losing you a week.
Prices that do not move
The number you enroll at is the number you finish at.
355 days a year. Pick one.
Sixty minutes, you fly the aircraft from the left seat, and the hour goes in a logbook as dual instruction. $229, credited in full against any program if you enroll within 24 hours. If you want the afternoon slot, say so when you book — now you know why.
Learn to fly here
flying lessons at Van Nuys Airportwhat a discovery flight actually iswhat happens on a first flight lessonflight training near you, by areahow to choose a flight schoolFull method
Written out so this can be checked or repeated. If you find an error in it, tell us and we will correct the page.
Source. Automated Surface Observing System (ASOS) routine hourly observations,
retrieved from the Iowa Environmental Mesonet archive, which republishes NOAA/NWS
observations. Station data pulled 16 August 2026.
Period. 1 August 2025 to 1 August 2026 inclusive — twelve full months.
Observations used. Routine (METAR) reports only, between 07:00 and 18:00 local
time at each station. Local time is applied per station, so daylight-saving shifts
are handled correctly and stations in different time zones are compared like for like.
Ceiling. The lowest reported layer with coverage BKN, OVC or VV. Layers reported
FEW or SCT are not ceilings and are excluded, consistent with FAA definitions.
Two thresholds.
This is the legal floor for VFR flight in Class D airspace.
miles. This is the more conservative standard most flight schools apply to student
solo and early dual instruction. It is the number that matters to a student pilot.
Flyable day. A calendar day counts as flyable when at least four daytime hourly
observations met the threshold, and the day had at least six valid observations.
Four hours is roughly two lesson slots including preflight and debrief.
Hourly tables. For each month and each hour, the percentage of observations at
that hour meeting the training minima across the whole period.
Known limitations.
component are not modelled, and any of them can scrub a lesson on a clear day.
temperature, so treat single-month figures as indicative rather than climatological.
under 365 at several fields.
Raw pulls and the analysis code are reproducible from the URLs in this repository.
Questions about flying weather in Los Angeles
Answers taken from the dataset above rather than from folklore.
Van Nuys Airport met student training minima on 355 of the 364 days we observed between August 2025 and August 2026, and met basic VFR minimums on 363. That is higher than the 300 days most Los Angeles flight schools claim, including us before we measured it.
On weather alone it is among the best in the country. Van Nuys recorded 355 flyable days against 277 at Hillsboro, Oregon and 278 at Everett, Washington. It is level with Phoenix Deer Valley at 356 and Kissimmee, Florida at 355, which undercuts the common advice to move to the desert to train faster.
June Gloom is the marine layer that pushes inland overnight in late spring and early summer. It takes mornings, not days. At Van Nuys only 40% of 7am observations in June met training minima, but 93% at 11am and 97% from 1pm onward, so an afternoon lesson in June is close to a certainty.
Between May and September, book afternoons. At Van Nuys the 1pm to 4pm window met training minima 97 to 100% of the time in every summer month. The pattern reverses in November and December, when late afternoons drop to 87 to 90% and mid-morning becomes the more reliable slot.
Measurably, yes. Van Nuys recorded 355 flyable days against Santa Monica's 343, and the gap is much wider in the mornings. In August, 84% of 7am observations at Van Nuys met training minima against 48% at Santa Monica. Van Nuys sits inland behind the hills, which keeps the marine layer off it.
Most schools apply a ceiling of at least 3,000 feet and visibility of at least 5 statute miles for student solo and early dual instruction. That is deliberately more conservative than the legal VFR floor of 1,000 feet and 3 miles, which is what this study used as its threshold.
On ceiling and visibility alone, roughly 9 days in 364 at Van Nuys were unusable for a student across a whole year. The bigger risk is time of day rather than date, with early mornings in May and June being the weakest slots at 40 to 52%. Wind and turbulence cancel lessons too and are not counted in that figure.
The weather data does not support it if you are already in Los Angeles. Van Nuys at 355 days is statistically level with Phoenix Deer Valley at 356 and central Florida at 355. There may be cost or airspace reasons to train elsewhere, but you will not gain flyable days.
Routine hourly METAR observations from the Automated Surface Observing System at each airport, covering 1 August 2025 to 1 August 2026, retrieved from the Iowa Environmental Mesonet archive of NOAA observations. That is roughly 120,000 individual observations across fifteen stations.
Cancellations cost calendar rather than cash with us, since you are not charged for a lesson that does not fly. The real cost is the retraining tax: a student flying twice a week finishes near the 40-hour FAR 61.109 minimum, while one flying twice a month commonly needs 75 hours because each lesson starts by relearning the last.
We rebook it at no charge, and where the syllabus allows we move the session into the Redbird MCX full-motion simulator instead, which is never cancelled for a ceiling. A standalone simulator session is $189, and 2 to 5 hours of simulator time are already included in every private pilot program.
Yes. The figures are computed from public NOAA observations and we are not claiming ownership of them. Reproduce the tables freely; a link back is appreciated but not required, and we will send the underlying CSVs and query URLs to anyone who asks.
Get the full training plan and price sheet
The three private pilot packages, what each one includes, the financing options and a realistic timeline built around how often you can actually fly. Sent to you in one email. Nobody will pressure you.
- Every package price, itemised
- Financing from $2,500 down
- A timeline based on your schedule